Retirement Calculator
Plan your financial future and calculate how much you need to save for a comfortable retirement. See projections based on the 4% withdrawal rule.
Your Information
Related Calculators
FIRE Calculator
Financial Independence, Retire Early planner
401k Calculator
Project your 401k balance
RMD Calculator
Required minimum distributions
Investment Calculator
Plan your investment growth
Social Security Calculator
Estimate retirement benefits
Compound Interest Calculator
See how investments grow
Important Disclaimer
This retirement calculator provides estimates for educational purposes only. It does not constitute personalized financial, tax, or investment advice. Projections assume consistent rates of return that may not reflect real-world conditions. Consult a qualified financial planner for guidance tailored to your specific needs.
Frequently Asked Questions
Retirement Calculator
Plan your financial future and calculate how much you need to save for a comfortable retirement.
Your Information
Retirement Projection
Enter your information to see retirement projections
Related Calculators
FIRE Calculator
Financial Independence, Retire Early planner
401k Calculator
Project your 401k balance
RMD Calculator
Required minimum distributions
Investment Calculator
Plan your investment growth
Social Security Calculator
Estimate retirement benefits
Compound Interest Calculator
See how investments grow
Retirement Planning Guide 2026: Step-by-Step Strategies for Financial Freedom
Why Retirement Planning Matters
Retirement isn't just about stopping work — it's about ensuring you have the financial freedom to live the life you want. Starting early, saving consistently, and making smart investment choices can mean the difference between a stressful retirement and a comfortable one.
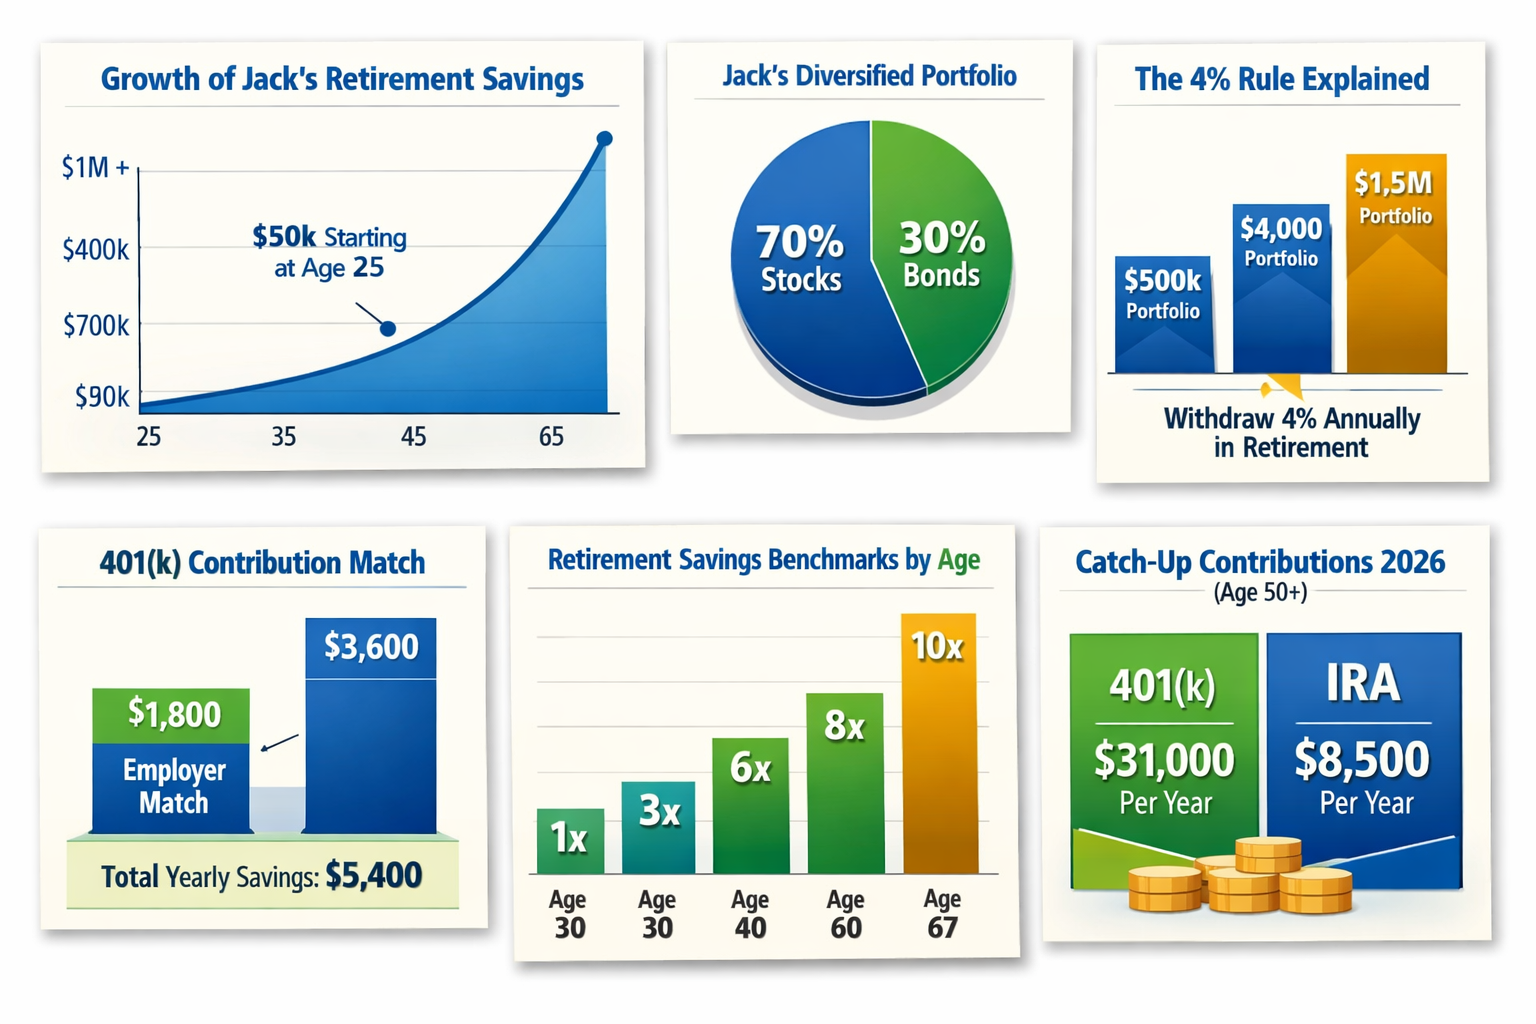
Jack's retirement journey — key metrics visualized
Step 1 – Start Early and Harness Compound Interest
The earlier you begin, the more powerful compound interest becomes. Investing $500/month starting at age 25 can grow to over $1.2M by age 65 at 7% returns. Waiting until 35 cuts that nearly in half.
Example Scenario — Jack, Age 25: Jack just started his first job earning $50,000/year. He contributes 10% ($5,000 annually) to his 401(k). With employer match and compound growth, Jack could have over $1M by age 65 — even if he never increases his contribution rate.
Step 2 – Diversify Your Investments
Don't put all your eggs in one basket. A balanced portfolio of stocks, bonds, and international assets reduces risk and improves long-term returns. Consider target-date funds or ETFs for automatic diversification.
Example Scenario — Jack, Age 35: Jack earns $75,000 and has $100,000 saved. He invests 70% in stocks, 30% in bonds. By diversifying across U.S. and international markets, he reduces risk while still aiming for growth.
Step 3 – Understand the 4% Rule (and Its Limits)
The 4% rule suggests you can withdraw 4% of your portfolio annually in retirement, adjusted for inflation, with a high chance of lasting 30 years. Example: $1M portfolio → $40,000/year. Critics argue today's markets may require 3.5% for safety. Dynamic "guardrails" strategies allow flexibility — spend more in good years, cut back in bad ones.
Example Scenario — Jack, Age 40: Jack earns $100,000 and has saved $300,000 (3× salary benchmark). If he continues saving 15% annually, he's on track to reach $1.5M by age 67 — enough to withdraw ~$60,000/year using the 4% rule.
Step 4 – Maximize Employer Contributions
Always contribute enough to capture your full 401(k) match. It's free money and an instant return on investment.
Example Scenario — Jack, Age 30: Jack earns $60,000. His employer matches 50% of the first 6% he contributes. By contributing $3,600 (6%), he gets $1,800 free from his employer — boosting his effective savings rate to 9% instantly.
Step 5 – Increase Contributions Gradually
Boost your savings rate by 1% each year or whenever you get a raise.
Example Scenario — Jack, Age 45: Jack earns $90,000 and currently saves 10%. Each year he increases his contribution by 1%. Within five years, he's saving 15% — an extra $4,500 annually that compounds into hundreds of thousands by retirement.
Step 6 – Review and Adjust Regularly
Life changes — so should your plan. Review annually and adjust for income, expenses, market conditions, and retirement goals.
Retirement Savings by Age: Are You on Track?
Fidelity Investments recommends saving a multiple of your annual salary by each age milestone. Here is the full benchmark table — and what you should have saved at 30, 40, 50, and 60:
Example: If you earn $70,000/year and are age 40, the 3× benchmark says you should have $210,000 saved.
| Age | Savings Target (× Salary) | On $50K salary | On $75K salary | On $100K salary | On $150K salary |
|---|---|---|---|---|---|
| Age 25 | 0.5× | $25,000 | $37,500 | $50,000 | $75,000 |
| Age 30 ★ | 1× | $50,000 | $75,000 | $100,000 | $150,000 |
| Age 35 | 2× | $100,000 | $150,000 | $200,000 | $300,000 |
| Age 40 ★ | 3× | $150,000 | $225,000 | $300,000 | $450,000 |
| Age 45 | 4× | $200,000 | $300,000 | $400,000 | $600,000 |
| Age 50 ★ | 6× | $300,000 | $450,000 | $600,000 | $900,000 |
| Age 55 | 7× | $350,000 | $525,000 | $700,000 | $1,050,000 |
| Age 60 ★ | 8× | $400,000 | $600,000 | $800,000 | $1,200,000 |
| Age 67 | 10× | $500,000 | $750,000 | $1,000,000 | $1,500,000 |
★ = Most commonly searched ages | Source: Fidelity Investments retirement savings guidelines. Assumes retirement at 67 with 45% income replacement from savings.
Example Scenario — Jack, Age 40: Jack earns $75,000. The 3× benchmark says he should have $225,000 saved. If he's behind, increasing contributions by 2% and using catch-up provisions after 50 can help close the gap.
Behind on savings?
Don't panic — increasing your contribution rate by just 1-2% per year significantly closes the gap. Use the calculator above to see how much difference an extra $100-$300/month makes.
Already 50+? Use catch-up contributions
If you're 50 or older, the IRS allows extra 401(k) contributions: $7,500 additional in 2026 (on top of the $23,500 standard limit) — plus $1,000 extra in IRAs.
How Much Do I Need to Retire? — by Age & Income
Using the 4% rule: to generate $X per month in retirement, you need 300× that amount saved (25× annual income). Here is the target nest egg for common retirement income goals:
| Monthly Retirement Income Needed | Annual Income | Required Nest Egg (4% rule) | Needed at Age 60 | Needed at Age 55 |
|---|---|---|---|---|
| $2,000/mo | $24,000/yr | $600,000 | $768,000 (+5yr growth) | $984,000 (+10yr growth) |
| $3,000/mo | $36,000/yr | $900,000 | $1,152,000 (+5yr growth) | $1,476,000 (+10yr growth) |
| $4,000/mo | $48,000/yr | $1,200,000 | $1,536,000 (+5yr growth) | $1,968,000 (+10yr growth) |
| $5,000/mo | $60,000/yr | $1,500,000 | $1,920,000 (+5yr growth) | $2,460,000 (+10yr growth) |
| $6,000/mo | $72,000/yr | $1,800,000 | $2,304,000 (+5yr growth) | $2,952,000 (+10yr growth) |
| $7,500/mo | $90,000/yr | $2,250,000 | $2,880,000 (+5yr growth) | $3,690,000 (+10yr growth) |
| $10,000/mo | $120,000/yr | $3,000,000 | $3,840,000 (+5yr growth) | $4,920,000 (+10yr growth) |
Assumes 7% annual portfolio growth for pre-retirement projections. 4% safe withdrawal rate. Does not include Social Security income.
Example Scenario — Jack & his spouse, Age 55: They want $90,000/year in retirement. Social Security will provide $30,000, so they need $60,000 from savings. At 4%, that requires $1.5M. With 10 years left, they increase contributions and plan to reach their target.
Understanding the 4% Rule in 2026: The Foundation of Retirement Income Planning
What Is the 4% Rule?
The 4% rule suggests retirees can safely withdraw 4% of their portfolio in the first year of retirement, then adjust that amount annually for inflation. Originating from the Trinity Study, it historically gave a 95% chance of lasting 30 years. A $1 million portfolio allows $40,000 in year one, then $41,000 in year two (assuming 2.5% inflation).
Why It's Being Reconsidered
Lower bond yields and higher stock valuations today mean many experts recommend more conservative withdrawal rates of 3–3.5%.
- At 3.5%, a $1 million portfolio provides $35,000 in year one instead of $40,000.
- Retirees with pensions or Social Security can afford more aggressive withdrawals since they rely less on portfolio income.
Dynamic Withdrawal Strategies
Static rules are giving way to flexible approaches:
- Guardrails method: Increase spending when markets perform well, cut back when they decline.
- This can raise sustainable withdrawal rates to 4.5–5%, but requires lifestyle flexibility.
Calculating Your Retirement Needs
Annual spending ÷ safe withdrawal rate = required portfolio size.
Guaranteed income sources (Social Security, pensions) reduce this requirement.
Tax-Advantaged Accounts in 2026
- 401(k): Pre-tax contributions, tax-deferred growth. 2026 limits: $23,500 ($31,000 for 50+).
- Roth IRA/401(k): After-tax contributions, tax-free withdrawals. Ideal for younger workers or those expecting higher retirement taxes.
- Traditional IRA: $7,500 limit ($8,500 for 50+). Deductibility depends on income.
- HSAs: Triple tax advantage. 2026 limits: $4,300 individual, $8,600 family.
Asset Allocation & Rebalancing
- Traditional rule: bonds = age.
- Modern rule: 110–120 minus age for stock allocation.
- Target-date funds automate this process.
- Rebalance annually or when allocations drift 5%+.
Social Security Optimization
- Claiming early (62) reduces benefits ~30%.
- Delaying until 70 increases benefits 24–32%.
- Break-even age: ~78–80.
- Married couples should coordinate claiming strategies to maximize survivor benefits.
Healthcare & Long-Term Care
- Medicare starts at 65.
- Medigap fills gaps; Medicare Advantage offers bundled alternatives.
- Long-term care costs average $90,000–110,000/year. Insurance or hybrid life policies can help mitigate risk.
Catch-Up Contributions in Your 50s
- 401(k): +$7,500
- IRA: +$1,000
- HSA: +$1,000
These allow accelerated savings during peak earning years.
FIRE & Early Retirement
- Aggressive saving (40–70% of income) enables retirement in 30s–50s.
- Challenges: healthcare before 65, longer horizons, sequence of returns risk.
- Solutions: Roth ladders, SEPP withdrawals, taxable accounts, geographic arbitrage.
Withdrawal Strategies
- Traditional sequence: taxable → traditional IRA/401(k) → Roth.
- Modern approach: proportional withdrawals to smooth taxes.
- Roth conversions before RMDs (age 73–75) reduce lifetime taxes.
Inflation & Longevity Risk
- Inflation erodes purchasing power: $60,000 at 65 = $108,000 at 95.
- Longevity risk: 25% chance one spouse lives to 97.
- Mitigation: annuities, delaying Social Security, conservative withdrawal rates.
Common Mistakes to Avoid
- Underestimating expenses (often 90–100% of pre-retirement).
- Claiming Social Security too early.
- Ignoring healthcare costs before Medicare.
- Over-reliance on portfolio withdrawals without guaranteed income.
Social Security Benefit by Claiming Age
Delaying Social Security increases your monthly benefit permanently. The table below shows benefit adjustments relative to Full Retirement Age (FRA = 67 for those born 1960 or later). Example assumes $2,000/month at FRA.
| Claiming Age | Benefit Adjustment | Monthly Benefit | Annual Benefit | Breakeven vs FRA |
|---|---|---|---|---|
| 62 | −30% | $1,400 | $16,800 | Never (always less) |
| 63 | −25% | $1,500 | $18,000 | — |
| 64 | −20% | $1,600 | $19,200 | — |
| 65 | −13.3% | $1,733 | $20,800 | — |
| 66 | −6.7% | $1,867 | $22,400 | — |
| 67 (FRA) | Baseline | $2,000 | $24,000 | Baseline |
| 68 | +8% | $2,160 | $25,920 | ~Age 78 |
| 69 | +16% | $2,320 | $27,840 | ~Age 79 |
| 70 | +24% | $2,480 | $29,760 | ~Age 80 |
Source: Social Security Administration. FRA = 67 for those born 1960+. Early claiming reduction = 5/9% per month for first 36 months, 5/12% per month thereafter. Delayed credits = 8%/year from FRA to age 70. Breakeven assumes no COLA adjustments.
State Taxes on Retirement Income (2026)
State tax treatment of Social Security benefits, pension income, and 401(k)/IRA withdrawals varies significantly. This can meaningfully affect retirement income planning.
| State | Social Security Taxed? | Pension/401(k)/IRA Taxed? | State Income Tax Rate | Retirement Friendliness |
|---|---|---|---|---|
| Florida | No income tax | No income tax | None | ★★★★★ |
| Texas | No income tax | No income tax | None | ★★★★★ |
| Nevada | No income tax | No income tax | None | ★★★★★ |
| Washington | No income tax | No income tax | None | ★★★★★ |
| Tennessee | No income tax | No income tax | None | ★★★★★ |
| Georgia | Not taxed | Partial exclusion | 1–5.49% | ★★★★☆ |
| Arizona | Not taxed | Partially exempt | 2.5% | ★★★★☆ |
| Pennsylvania | Not taxed | Not taxed | 3.07% | ★★★★☆ |
| Illinois | Not taxed | Not taxed | 4.95% | ★★★☆☆ |
| New York | Not taxed | Partial exclusion | 4–10.9% | ★★★☆☆ |
| Colorado | Partial | Partial exclusion | 4.4% | ★★★☆☆ |
| Virginia | Not taxed | Partial exclusion | 2–5.75% | ★★★☆☆ |
| California | Not taxed | Fully taxed | 1–13.3% | ★★☆☆☆ |
| Minnesota | Partially taxed | Fully taxed | 5.35–9.85% | ★★☆☆☆ |
| Vermont | Partially taxed | Fully taxed | 3.35–8.75% | ★★☆☆☆ |
Source: State tax authority websites; Kiplinger Retirement Tax Map 2026. Retirement friendliness reflects combined impact of SS taxation, pension exclusions, and overall tax burden. Consult a tax professional for state-specific advice.
Important Disclaimer
This retirement calculator provides estimates for educational and planning purposes only. It does not constitute personalized financial, tax, or investment advice. Projections are based on assumptions about consistent rates of return, inflation, and contribution levels that may not reflect real-world conditions. Consult a qualified financial planner for guidance tailored to your specific needs.
How to Calculate Retirement Savings — Step by Step
Retirement projections use the Future Value of an Annuity formula — compounding your contributions over time:
- 1Step 1: Set your monthly contribution (P)How much you save each month. Example: $500/month.
- 2Step 2: Estimate annual return, convert to monthly (r)7% annual → r = 7 ÷ 12 ÷ 100 = 0.005833/month. A 7% real return is a common long-term stock market assumption (US market ~10% nominal, ~7% inflation-adjusted).
- 3Step 3: Calculate total months (n)Retire at 65, start at 30 → 35 years × 12 = 420 months.
- 4Step 4: Apply the formulaFV = 500 × [(1.005833)^420 − 1] / 0.005833 + 0 × (1.005833)^420. (1.005833)^420 = 11.26. FV = 500 × (11.26 − 1) / 0.005833 = 500 × 10.26 / 0.005833 = $879,600.
- 5Step 5: Add existing savingsIf you already have $50,000 saved: +50,000 × 11.26 = +$563,000. Total = $879,600 + $563,000 = $1,442,600.
- 6Step 6: Apply the 4% withdrawal rule$1,442,600 × 4% = $57,704/year → $4,809/month in retirement income (inflation-adjusted).
Retirement Savings Examples
Starting at 30, Retiring at 65 — How Much Will I Have?
35 years of saving, 7% average annual return
| Monthly Contribution | Total Contributed | Balance at 65 | Monthly Income (4%) |
|---|---|---|---|
| $200 | $84,000 | $320,000 | $1,067/mo |
| $500 | $210,000 | $880,000 | $2,933/mo |
| $1,000 | $420,000 | $1,760,000 | $5,867/mo |
| $2,000 | $840,000 | $3,520,000 | $11,733/mo |
How Much Do I Need to Retire at 65?
Using the 4% rule: Nest egg needed = Annual spending ÷ 4%
| Annual Spending | Nest Egg Needed | Monthly Save from 30 (7%) |
|---|---|---|
| $40,000/yr | $1,000,000 | $568/mo |
| $60,000/yr | $1,500,000 | $852/mo |
| $80,000/yr | $2,000,000 | $1,136/mo |
| $100,000/yr | $2,500,000 | $1,420/mo |
The Cost of Waiting — Why Starting Early Matters
$500/month at 7% return, retiring at 65:
| Start Age | Years Saving | Total Contributed | Balance at 65 |
|---|---|---|---|
| Age 25 | 40 yrs | $240,000 | $1,310,000 |
| Age 30 | 35 yrs | $210,000 | $880,000 |
| Age 35 | 30 yrs | $180,000 | $584,000 |
| Age 40 | 25 yrs | $150,000 | $379,000 |
| Age 45 | 20 yrs | $120,000 | $237,000 |
Starting at 25 vs 45: same monthly contribution, but $1,073,000 more at retirement — purely from compound growth over extra 20 years.